Expert support for data analysing, interpreting, and reporting outcome-based research. Get help with data, methods, and results—accurate, fast, and tailored to your project.
2. Understanding the PICOT Framework in Clinical and Nursing Research
3. What is PICOT? Structuring Clinical Questions
3.1. An Example of PICOT
4. Who Uses the PICOT Framework?
4.1. Clinicians and Physicians
4.2. Nurses and Nursing Research
4.3. Allied Health Professionals
4.4. Evidence-Based Practice and Medical Research
5. Applying PICOT to Different Study Designs
5.1. PICOT in Randomized Controlled Trials (RCTs)
5.2. PICOT in Cohort Studies and Examples
5.3. PICOT in Cross-Sectional Studies and Examples
5.4. PICOT in Cross-Sectional Studies and Examples
5.5. PICOT in Systematic Reviews and Meta-Analyses
6. Statistical Methods in PICOT-Based Research
6.1. Population: Sampling and Statistical Power
6.2. Intervention and Comparison: Effect Measures and Group Analysis
6.3. Outcome: Measurement and Analysis
6.4. Time: Follow-Up Duration and Timing of Analysis
7. Conclusion: From PICOT Question to Statistical Evidence
1. Introduction
The PICOT framework is a vital tool in clinical, nursing, and medical research. It helps structure focused, answerable questions by defining the Population, Intervention, Comparison, Outcome, and Time. Widely used in evidence-based practice, PICOT supports better study design and clearer statistical analysis. This guide explains the PICOT format, who uses it, how it applies to study designs like RCTs and cohort studies, and which statistical methods are most effective in PICOT-based research.
About Us
At OnlineSPSS.com, we provide expert statistical consulting and data analysis services tailored for PICOT-based research and dissertations. Our mission is to simplify complex statistical tasks, so you can focus on what matters most—formulating clear clinical questions and delivering impactful, evidence-based results. Whether you’re evaluating healthcare interventions, comparing treatment outcomes, or analysing time-to-effect measures, our team delivers accurate, efficient, and publication-ready solutions.
Who We Help: PhD Students, Nursing and Medical Researchers, Clinical Academics Project Types: PICOT-Based Dissertations, Evidence-Based Practice Projects, Clinical Trials, Academic Assignments Our Services: Data Management, Statistical Analysis, Hypothesis Testing, Writing Methods and Results
Whether you work with IBM SPSS, R, Stata, NVivo, or another software, our statisticians are experienced in all tools required for PICOT data analysis. From refining your PICOT question to running the right statistical test and interpreting the results, we’re with you every step of the way.
Click “Get Instant Quote” fill in required details, and upload supporting files.
2. Make the Payment
Pay securely through PayPal after receiving your custom quote.
3. Get Your Solutions
Receive high-quality, plagiarism-free results via email on time.
2. Understanding the PICOT Framework in Clinical and Nursing Research
The PICOT framework is a foundational tool in evidence-based healthcare for formulating clear, focused research questions. PICOT stands for Population, Intervention, Comparison, Outcome, and Time. This format helps clinicians and researchers break down a broad query into specific components, which in turn guides study design, literature searches, and statistical analysis. Below, we provide a comprehensive overview of PICOT, its structure, who uses it, how it applies to different study designs (especially cohort studies and randomized trials), and the statistical methods pertinent to each PICOT element.
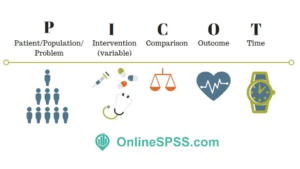
PICOT Framework
3. What is PICOT? Structuring Clinical Questions
PICOT is a mnemonic for the five key elements of a well-built clinical or research question. Each element focuses the inquiry:
Population (P): The patient population or problem of interest – the group of people you intend to study. This should be clearly defined by characteristics like condition, age, setting, etc. (e.g. adults 18–60 with chronic neck pain). A balance is needed so the population is specific enough to be relevant, yet broad enough to be generalizable.
Intervention (I): The main intervention or treatment being considered (e.g. a drug, procedure, educational program, or exposure). This is what is being applied to the population in hopes of an effect.
Comparison (C): The alternative to the intervention – often a control or standard care group for comparison. Not every question has a direct comparison, but when applicable this could be a placebo, another treatment, or no intervention. In clinical trials this is the control arm (possibly the current gold-standard treatment).
Outcome (O): The effect or result you plan to measure to determine the intervention’s impact. Outcomes should be clinically relevant and measurable (e.g. symptom improvement, recovery rate, complication occurrence). Choosing validated outcome measures improves the quality of the study.
Time (T): The timeframe for observing the outcome. This might be the duration of follow-up or how long it takes to see the effect (e.g. 6 weeks of treatment, 1 year follow-up). Not every question specifies a time, but including one can clarify the context (acute vs. long-term outcomes).
In practice, a well-formulated PICOT question might read:
“In [Population], how does [Intervention] compared to [Comparison] affect [Outcome] within [Time]?”
Formulating a question in this structured way ensures that the inquiry is specific and answerable. It “succinctly gives structure” to clinical or research questions, helping to drill down to the essence of the query By clearly defining each element, researchers and clinicians can identify relevant evidence and design studies to address the question directly.
3.1. An Example of PICOT
Example: As an illustration, consider a clinical research scenario asking: “In adults with chronic neck pain (P), what is the minimum dose of spinal manipulation (I) necessary to produce a clinically important improvement in neck pain (O) compared to supervised exercise (C) over 6 weeks (T)?”
In a published example of an RCT, the Population was defined as adults 18–60 with chronic mechanical neck pain (specific inclusion/exclusion criteria applied); the Intervention was cervical spine manipulation (at varying frequencies/doses); the Comparison was a standard supervised exercise regimen; the Outcome was change in neck pain intensity measured on a 100-mm visual analog scale (VAS); and Time was weekly measurements over a 6-week period This clearly framed question guided the study design and ensured each component was addressed in the research.
4. Who Uses the PICOT Framework? and Some Example of PICOT
PICOT originated in evidence-based medicine in the mid-1990s as a way for clinicians to frame focused clinical questions. Since then, it has been adopted by a wide variety of healthcare professionals and fields, becoming a common approach in clinical, nursing, and medical research.
Who Uses the PICOT Framework
Key users and contexts include:
4.1. Clinicians and Physicians
Doctors use PICOT to formulate questions about therapy, diagnosis, or prognosis during patient care. It was first described as a tool for constructing a “well-built clinical question” to find precise answers in medical literature.
For example, a physician might ask: “In elderly patients with hypertension (P), does a low-sodium diet (I) compared to standard diet (C) reduce blood pressure (O) over 3 months (T)?” – then search for high-quality studies answering that question.
4.2. Nurses and Nursing Research
PICOT is heavily used in nursing practice and research, especially as part of evidence-based practice (EBP) initiatives. Nurses often pose PICOT questions to improve patient care or processes. It’s widely taught in nursing programs and residency programs for developing EBP projects.
For instance, a bedside nurse might formulate: “In post-surgical patients (P), does a nurse-led ambulation program (I) versus no structured ambulation (C) affect the incidence of pneumonia (O) during the hospital stay (T)?”
Nursing educators and librarians collaborate to teach nurses how to develop PICOT-based search strategies to find the best evidence to answer such practice questions. In Doctor of Nursing Practice (DNP) projects, crafting a strong PICOT question is often the first step in addressing a clinical problem through evidence-based change.
4.3. Allied Health Professionals
Other healthcare fields like pharmacy, physical therapy, occupational therapy, and public health also use PICOT or its variations to frame research questions. Anytime a practitioner or investigator needs to find evidence or design a study, PICOT helps outline what exactly they’re looking at.
For example, a physical therapist might ask: “In stroke patients with hemiplegia (P), does mirror therapy (I) compared to standard rehab exercises (C) improve arm motor function (O) within 4 weeks of therapy (T)?”
4.4. Evidence-Based Practice and Medical Research
Beyond individual patient care, PICOT is used in systematic reviews and guideline development. Research teams form PICOT questions to define inclusion criteria for reviews (specifying the Population, Interventions, Comparators, Outcomes of interest, and sometimes adding S for Study design, as in PICOS). This ensures the review or study stays focused. For example, guideline developers might use PICOT to ask whether a new medication is better than an old one for a specific patient group and outcome at a certain follow-up point, which then drives the literature search and evidence synthesis.
In summary, PICOT is a versatile framework used across clinical and academic settings. Its strength lies in creating a focused, well-built, and searchable question to guide research and decision-making. Whether you are a clinician at the bedside, a nurse conducting a quality improvement project, or a researcher planning a trial, PICOT helps clarify your objectives and communicate them clearly.
A well-formulated PICOT question not only guides literature searches but also strongly influences the choice of study design. Different types of research designs may be used to answer a PICOT question, and the framework is especially useful for planning Randomized Controlled Trials (RCTs) and Cohort Studies. It’s important to choose a design that best fits the question being asked. Below we discuss how PICOT is used in various study designs, with emphasis on RCTs and cohort studies, and mention other designs like cross-sectional and case-control studies.
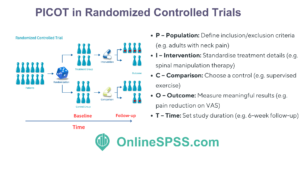
5.1. PICOT in Randomized Controlled Trials (RCTs) and Examples
RCTs are considered the gold standard for evaluating interventions because randomization aims to equalize known and unknown factors between groups, isolating the effect of the intervention. When a PICOT question is about the effect of a treatment or intervention, an RCT is often the appropriate design if feasible. The PICOT elements map onto an RCT protocol as follows:
Population: The inclusion and exclusion criteria of the trial define the Population. For example, in an RCT guided by a PICOT question, the population might be “adults aged 18–60 with chronic mechanical neck pain” as in the earlier example. Researchers carefully specify who is eligible to ensure the sample truly represents the population of interest and to increase internal validity (sometimes narrowing criteria to reduce confounding variables).
Intervention: The trial’s experimental arm corresponds to the Intervention. This could be a new drug, therapy, or procedure. The PICOT framework forces clarity on what exactly is done: e.g. “cervical spinal manipulation therapy, applied 1–3 times per week for 2–6 weeks”. In planning an RCT, the intervention must be standardized and consistently delivered. PICOT helps describe it in detail (dose, frequency, technique) so that it’s reproducible.
Comparison: The control or comparison arm in an RCT is directly drawn from the PICOT question’s Comparison element. It might be a placebo, usual care, or an alternative treatment. In our example, the comparison was “a supervised exercise regimen” used as an active control. By specifying the comparison (e.g. placebo pill, standard treatment X, no intervention), the PICOT question ensures the study includes a relevant reference group. This element is critical for interpreting results: without a proper comparator, one cannot attribute outcomes to the intervention reliably.
Outcome: RCT protocols define primary and secondary outcomes to measure, stemming from the Outcome in the PICOT question. For instance, the primary outcome might be “reduction in neck pain on a 100mm VAS scale” . PICOT focuses the investigator on what outcome is clinically meaningful – pain reduction, complication rate, recovery time, etc. In RCTs, outcomes should be assessed with blinding when possible (to minimize bias) and using validated instruments. The PICOT example noted that a 13 mm difference on the VAS was considered a clinically important change, which would be a target for the trial to detect.
Time: The duration of the study and follow-up is defined by the Time element. RCTs might have outcomes at a specific time (e.g. at 6 weeks, at 6 months, etc.) or multiple time points. In the neck pain trial example, outcomes were measured weekly over a 6-week treatment period. Time can also include the duration of follow-up after an intervention to see if effects are sustained or if any long-term outcomes occur.
PICOT in Randomized Controlled Trials
Using PICOT in the planning stage of an RCT ensures that the trial is designed to directly answer the clinical question. Everything from sample size calculations to case report form design flows from the PICOT question. It also makes it easy for others (including ethical review boards and other researchers) to understand the trial’s purpose. However, while RCTs are powerful, they can be costly and time-consuming, and not every PICOT question is feasible to answer with an RCT (for ethical or practical reasons). For example, you cannot randomize harmful exposures like smoking vs. non-smoking; in such cases, observational designs are needed. This is where PICOT also extends to other study designs.
5.2. PICOT in Cohort Studies and Examples
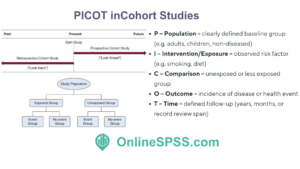
Cohort studies are observational designs where participants are followed over time to observe outcomes. They can be prospective (following subjects forward) or retrospective (using past records). PICOT is frequently used to frame cohort study questions, especially for prognosis or exposure-related inquiries, where an RCT may not be possible or ethical.
When applying PICOT to a cohort study:
Population: A cohort’s population is defined similarly – e.g. “postmenopausal women without heart disease at baseline” or “children under 5 in a certain community”. Clear definition is crucial so that inclusion criteria reflect the population of interest. PICOT helps articulate this upfront. For instance, a cohort PICOT question might be: “In adult smokers with no prior lung disease (P), does smoking a pack a day for 10 years (I) compared to non-smokers (C) influence the incidence of lung cancer (O) over 20 years (T)?” Here, the population is well-defined at the start (smokers and non-smokers without lung cancer).
Intervention/Exposure: In an observational study, there may not be a researcher-induced intervention. Instead, the “I” can be considered an exposure or risk factor. In the example above, smoking is the exposure of interest. The cohort is then often divided by exposure status (exposed vs. unexposed) to mirror the Intervention vs. Comparison groups. PICOT framing ensures that even in an observational context, we identify a specific factor whose effect we want to study.
Comparison: The comparison group in a cohort study would be those not exposed or those with a different level of exposure. For example, non-smokers (or perhaps light smokers) serve as the comparison for heavy smokers. By explicitly stating the comparison group in the PICOT question, researchers can design the cohort (or the analysis) to include that reference group. This might mean recruiting a parallel group of non-exposed individuals or simply making sure to measure exposure levels to allow grouping. Unlike RCTs, the groups in a cohort are not randomized, so investigators must be mindful of baseline differences and potential confounding factors when comparing outcomes.
Outcome: Outcomes in cohort studies are often the development of a condition or an event (incidence of disease, mortality, etc.), observed over the follow-up period. The PICOT question identifies what outcome to track (lung cancer incidence in our example). Sometimes multiple outcomes are tracked, but typically one primary outcome is the focus, aligned with the PICOT query. Outcomes should be defined with the same rigor as in RCTs, using consistent diagnostic criteria or measurements throughout the study.
Time: Cohort studies often explicitly involve a follow-up period – months, years, or even decades. The Time element indicates how long participants are observed. Our example specifies a 20-year period. Time is crucial in cohort studies because the incidence of outcomes and the effect of exposures can depend on the length of follow-up. A well-framed PICOT question will suggest whether the focus is short-term outcomes (e.g. one-year survival) or long-term outcomes (e.g. 10-year cancer incidence). In retrospective cohorts, “Time” might be the span of records reviewed.
PICOT in Chort Studies
Cohort studies structured by PICOT can provide valuable evidence, especially for questions of prognosis or harm.
For example, a famous Nurses’ Health Study question could be framed in PICOT form to investigate:
“In middle-aged women (P), does long-term use of hormone replacement therapy (I) compared to no hormone therapy (C) affect the risk of breast cancer (O) over 10+ years (T)?” – which was addressed through observational follow-up.
One caveat is that because groups are not randomized, confounding can bias results (e.g. if smokers differ in other ways from non-smokers). Researchers may need to measure and adjust for confounders (like age, diet, etc.) in the analysis. Nonetheless, PICOT helps in planning what data to collect to account for these factors and answer the core question. Prospective cohorts are generally easier to administer than RCTs in terms of logistics and ethics, but they do require careful design to make valid comparisons.
5.3. PICOT in Cross-Sectional Studies and Examples
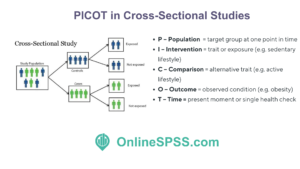
These studies examine a population at a single point in time (or over a very short period) to investigate prevalence or associations. A PICOT question for a cross-sectional study might look at a Population and an Outcome without a clear intervention (sometimes the “I” is a particular characteristic or exposure at the time). For example:
“In adults in City X (P), is there an association between having a sedentary lifestyle (I) compared to an active lifestyle (C) and the presence of obesity (O) at a single annual health check (T)?”
PICOT in Cross Sectional Studies
Here Time is a single measurement (present time) and the “Intervention” is not a treatment but a risk factor or trait. Cross-sectional PICOT questions help define what data to collect in a survey or prevalence study. These studies are relatively fast and inexpensive since they gather data once. However, because exposure and outcome are measured together, it’s hard to infer causality, and there can be recall bias if participants are asked about past behaviors.
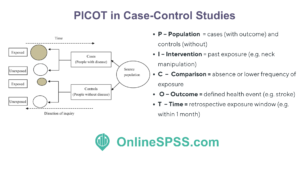
5.4. PICOT in Case-Control Studies
These are retrospective studies particularly useful for rare outcomes or outcomes that take a long time to manifest. They start with people who have the outcome (cases) and compare them to those without (controls), looking backward to compare exposures. A PICOT question for a case-control study might be:
“In patients who suffered a vertebrobasilar stroke (P – cases) compared to those who did not (C – controls), was there a higher odds of recent chiropractic neck manipulation (I/exposure) prior to the event (O: having a stroke) within the last month (T)?”
PICOT in Case Control Studies
This is essentially how a famous study was framed to investigate a possible link between chiropractic care and stroke . In this framework, the Outcome is fixed (stroke happened or not), and the question is querying a past exposure (intervention) frequency. PICOT helps ensure cases and controls are defined from the same population and that the timing of exposure is considered. Case-control PICOT questions highlight the need to control for confounders as well, since groups are selected based on outcome and may differ in other respects.
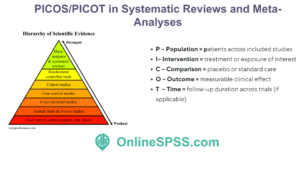
5.5. PICOT in Systematic Reviews and Meta-Analyses
As noted earlier, PICOT (or PICOS) often guides the inclusion criteria for evidence synthesis. For example, a Cochrane review might state a PICOT question to determine which studies to include (P = patients with condition Y, I = a specific intervention, C = placebo or standard care, O = a particular outcome, T = follow-up duration required). This ensures a structured approach to summarizing evidence.
PICOS in Systemartic Reviews/ Meta Analyses
In all these designs, the PICOT framework serves as a planning blueprint. It forces clarity about what relationship is being examined. The format is flexible – sometimes “I” may stand for an exposure or prognostic factor instead of a deliberate intervention, and “T” might be omitted if not applicable (for example, in many case-control or cross-sectional studies, an explicit timeframe may not be stated beyond saying it’s retrospective). The key is that PICOT’s structured thinking can be “adapted to [researchers’] needs” across various methodologies. By framing the question with PICOT, investigators can more easily decide which design fits the question and anticipate the strengths and limitations of that design.
6. Statistical Methods in PICOT-Based Research
After formulating a question with PICOT and designing an appropriate study, researchers must collect and analyze data to answer the question. Each component of PICOT has implications for the statistical methods used in a study. Below, we discuss how researchers approach the statistical analysis for each part of PICOT (where applicable), including study design considerations and example methods for analyzing intervention effects and outcomes. The PICOT framework not only shapes the research question but also informs the choice of statistical tests and analysis plan.
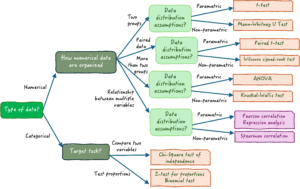
Choosing the Right Statistical Test
6.1. Population: Sampling and Statistical Power
Defining the Population in a PICOT question guides how researchers select subjects and how they generalize findings. Key statistical considerations for the population include:
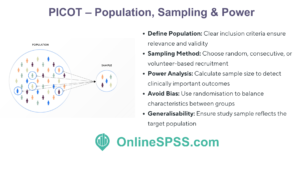
Sampling Method: Researchers decide how to sample the population of interest. This could be a random sample from the target population, consecutive patients meeting criteria, or volunteers, depending on feasibility and ethics. The goal is to recruit a sample representative of the Population defined in PICOT. During analysis, they will often provide descriptive statistics (means, medians, proportions) for the population’s baseline characteristics. For example, in a clinical trial one typically tables the demographic and clinical features of participants (age, gender mix, baseline health metrics) to describe the Population and ensure the groups are comparable at baseline.
Sample Size and Power Analysis: A critical statistical step related to the Population is determining how many subjects are needed – this is where power analysis comes in. Because PICOT specifies the outcome of interest and often the magnitude of effect considered important, researchers can calculate the sample size needed to have sufficient power (probability of detecting an effect if one truly exists). For instance, if the PICOT question expects a certain difference in outcome between the intervention and control, the sample size is chosen to reliably detect that difference with statistical significance (commonly at p < 0.05). Effect size, variance in the outcome, and desired power (usually 80% or 90%) feed into these calculations. As part of planning, researchers identify “what amount of difference and how many patients would be required to both statistically and clinically conclude the intervention was effective”. In other words, they consider the minimum clinically important difference in the Outcome and ensure the sample is large enough to detect it statistically. Underpowering a study (too small a Population) might miss a real effect, whereas overpowering (very large sample) can detect even trivial effects, so planning is important for ethical and practical reasons.
Randomization and Allocation (for trials): While not a statistical analysis per se, in an RCT the Population is typically randomly allocated to Intervention or Comparison groups. Randomization is a method to ensure the Population’s characteristics are evenly distributed between groups, preventing selection bias. After randomization, researchers use statistics to check baseline comparability – for example, comparing mean age or sex distribution between groups (often using t-tests or chi-square tests on baseline variables, although due to randomization, significant differences are due to chance). If the PICOT question involves multiple centers or clusters, stratified randomization or cluster adjustment in analysis may be used.
Generalizability: The Population defined by PICOT also bounds to whom the results apply. Statistically, this means the inference is strictly valid for populations similar to the study sample. Researchers often discuss this qualitatively, but sometimes they may compare their sample to the broader population (using epidemiological data) to see if it’s reasonably representative.
PICOT – Population, Sampling & Power
In summary, the Population component drives how subjects are selected and how many are needed. By addressing the Population explicitly, PICOT leads researchers to plan for adequate statistical power and representative sampling . During analysis, population considerations show up in descriptive summaries and in ensuring any comparisons between groups account for population differences.
6.2. Intervention and Comparison: Effect Measures and Group Analysis
The Intervention (I) and Comparison (C) elements of PICOT set up the core comparison that will be analyzed statistically. Whether in a trial or observational study, researchers will be comparing outcomes between two or more groups (e.g. Intervention vs. Control) or between those exposed vs. unexposed. Key statistical considerations and methods include:
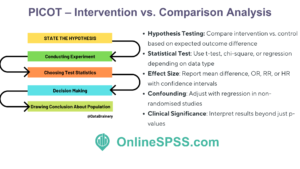
Hypothesis Testing: From the PICOT question, researchers derive hypotheses. Typically, the null hypothesis states there is no difference between the intervention and comparison in terms of the outcome, and the alternative hypothesis states there is a difference (or a particular direction of difference). For example, null: “No difference in pain relief between manipulation and exercise,” alternative: “Manipulation provides greater pain relief than exercise.” Statistical tests are chosen to test this hypothesis.
Choice of Statistical Test (Two-Group Comparison): The nature of the Intervention and Comparison (independent groups, paired observations, etc.) and the type of Outcome (continuous, binary, ordinal) determine the appropriate test. Common scenarios:
For a binary outcome (yes/no result like disease occurrence, cure rate, complication yes/no) in two independent groups, a chi-square test or Fisher’s exact test is often used to assess whether the proportion with the outcome differs between I and C. Alongside this, researchers often calculate an odds ratio (OR) or relative risk (RR) with a 95% confidence interval to quantify the effect size . For example, in a cohort study of smoking vs. lung cancer, they might report “smokers had an OR of X for developing lung cancer compared to non-smokers.”
For a continuous outcome (e.g. blood pressure level, pain score) measured in two independent groups, an independent samples t-test is commonly used (if the data meet assumptions of normality and equal variance). This test compares the means between the Intervention group and Comparison group. If assumptions are violated, a non-parametric test like Mann-Whitney U may be used instead. The result might be reported as “mean difference in outcome between groups” with a confidence interval.
For time-to-event outcomes (like time until recovery or survival time), if the PICOT question involves an outcome over time, survival analysis techniques such as the Kaplan–Meier method (to estimate survival curves) and the log-rank test (to compare curves between groups) are used. A Cox proportional hazards regression might be used to estimate the hazard ratio between Intervention and Comparison (e.g. hazard of event with treatment vs. control).
Multiple Groups or Factors: Sometimes PICOT may involve more than one comparison group or multiple interventions (e.g. a three-arm trial, or a factorial design). In such cases, an analysis of variance (ANOVA) might be used for continuous outcomes across multiple groups, or a chi-square for multiple categories of exposure. For factorial designs (like the 3×4 factorial example in the neck pain RCT scenario, two-way ANOVA or other multifactorial analysis is used to assess main effects and interactions between factors.
Adjusting for Confounders: In non-randomized studies (cohort or case-control, or even RCTs with imbalances), statistical methods are used to adjust for other variables that could affect the outcome. Techniques include multivariable regression models (linear regression for continuous outcomes, logistic regression for binary outcomes, Cox regression for time-to-event outcomes). For example, in a cohort PICOT question about smoking (I) vs non-smoking (C) on lung cancer (O), researchers might use a logistic regression model including smoking status and other factors like age, asbestos exposure, etc., to isolate the effect of the Intervention (smoking). The PICOT framework identified the main comparison, and the analysis then ensures that comparison is as fair as possible by adjusting for population differences.
Effect Size and Confidence Intervals: Regardless of the specific test, researchers will report effect size metrics to show the magnitude of difference between the Intervention and Comparison. This could be a mean difference, risk difference, relative risk, odds ratio, or hazard ratio depending on context. A 95% confidence interval (CI) is typically given for these estimates to indicate the precision of the estimate. For instance, an RCT might report that the intervention reduced pain by an average of 1.5 points more than control (95% CI 0.5 to 2.5, p = 0.01), or that the relative risk of infection with an intervention vs. control is 0.75 (95% CI 0.60–0.95).
Statistical Significance vs. Clinical Significance: An important consideration highlighted by PICOT planning is the difference between a statistically significant result and a clinically meaningful result. Because PICOT questions often arise from clinical need, researchers pre-define what outcome difference would be clinically important (like the 13 mm on a pain scale example). When analyzing results, they interpret the p-values in context: a very small difference can be statistically significant if the sample is huge, but may not matter clinically. Conversely, a meaningful difference might show up with a strong trend but not reach p<0.05 if the study was underpowered. Reporting both statistical significance and referencing that threshold for clinical importance is good practice.
PICOT – Comparison Analysis
In summary, the Intervention vs. Comparison analysis is the heart of answering a PICOT question. Statistically, it involves selecting the right test to compare groups, ensuring assumptions are met (e.g. normality for t-test, sufficient sample per cell for chi-square), and possibly using adjusted analyses in observational studies. The PICOT framework essentially lays out the blueprint for this comparison, and statisticians “map” the PICOT elements to appropriate analytical techniques . For example, knowing you have two independent groups (I vs C) and a categorical outcome leads you to a chi-square test ; two groups and a continuous outcome leads to a t-test; matched pairs (like pre/post in one group) might lead to a paired t-test or McNemar’s test, and so on. The result is evidence for or against the hypothesis that the intervention makes a difference compared to the alternative.
6.3. Outcome: Measurement and Analysis
The Outcome (O) element in PICOT not only guides what is measured but also has implications for how data are collected and analyzed:
Outcome Measurement: Researchers must ensure the outcome is measured accurately and consistently. This often involves using validated instruments or objective measures. For example, if the outcome is blood pressure reduction, they will use calibrated blood pressure cuffs and standardized protocols; if the outcome is a questionnaire score, they’ll use a questionnaire that’s been validated in that population. Good outcome measurement practice increases both internal validity (correctly measuring the effect) and external validity (applicability of results), as well-measured outcomes produce more reliable data . The PICOT framework encourages specifying the outcome measure in advance, which helps avoid the pitfall of changing outcomes mid-study or “outcome shopping.”
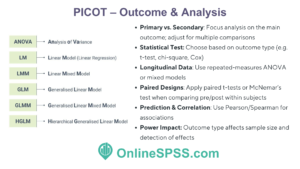
Primary vs Secondary Outcomes: Often a PICOT question focuses on a primary outcome (the main outcome of interest). Studies may also examine secondary outcomes, but these are usually considered exploratory. In analysis, the primary outcome is given greatest emphasis; sample size is usually calculated for it, and statistical significance is assessed primarily on it. Secondary outcomes might be analyzed similarly but with caution regarding multiple comparisons (sometimes adjustments like Bonferroni correction are applied if many outcomes are tested).
Data Types and Statistical Tests: As discussed above, the type of outcome (continuous, binary, ordinal, time-to-event) dictates the statistical tests and models used:
Continuous outcomes → compare means (t-test/ANOVA, or non-parametric equivalent; linear regression models).
Binary outcomes → compare proportions (chi-square; logistic regression for adjustments).
Ordinal outcomes → possibly use non-parametric tests (Mann-Whitney U, Kruskal-Wallis) or logistic regression (ordinal logistic if proportional odds assumption holds).
Outcome Distribution and Assumptions: In analyzing outcomes, researchers check statistical assumptions. For example, is the outcome roughly normally distributed in each group (which a t-test assumes)? Are variances equal? If an outcome is highly skewed, they might log-transform it or use non-parametric tests. If outcomes are counts (e.g. number of hospital visits), they might use Poisson or negative binomial regression. These decisions ensure the analysis is appropriate for the outcome data. PICOT doesn’t explicitly dictate this, but by knowing the outcome variable in advance, one can plan for proper analysis methods.
Repeated Measures and Longitudinal Outcomes: Sometimes PICOT questions involve outcomes measured at multiple time points (especially if the Time element includes multiple follow-ups). For example, measuring blood pressure at 1 month, 3 months, 6 months post-intervention. In such cases, specialized statistical methods are used:
Repeated-measures ANOVA or mixed-effects models can assess changes in outcomes over time within and between groups, taking into account the correlation of repeated observations on the same subject . These models can test if there is a significant interaction between time and intervention (i.e. whether outcome trajectories differ by group).
Paired tests: If the PICOT question essentially asks about change from baseline in one group (with baseline serving as the “Comparison”), a paired t-test (for a single group pre vs post) or McNemar’s test (for paired binary outcomes) might be used. The PICOT question format can be adapted to a within-subject scenario (e.g. “In patients before and after intervention, does [intervention] improve [outcome] over [time]?”).
The PICOT question format even allows one to frame correlation or prediction questions (as seen in the PICOT question generator examples. For instance, a correlation study might ask: “In adolescents (P), is there a correlation between daily screen time (I) and anxiety levels (O) at 1 year (T)?” – here statistical analysis would use correlation coefficients (Pearson or Spearman correlation) to quantify the association.
Influence on Power and Sample Size: The nature of the outcome measure can affect the sample size needed and the power of the study. For example, if an outcome is very common in both groups, it might be harder to detect a difference (requiring more patients). If an outcome measure is noisy or imprecise, variability is high and it again needs a larger sample to see an effect. By clearly defining the outcome, researchers can use prior data to estimate variance or incidence and plug those into power calculations. As mentioned earlier, measuring outcomes with high precision and validity increases the ability to detect significant findings (statistical power) and the accuracy of effect size estimates .
PICOT – Outcome Analysis
Overall, the Outcome component of PICOT translates into a concrete plan for data collection and analysis of results. Researchers must align their statistical methods to the outcome’s characteristics. They also must interpret the outcome results in context: an intervention may have multiple outcomes (some positive, some negative), so PICOT keeps focus on the primary outcome relevant to the original question. After analysis, the evidence is compiled to answer: did the Intervention improve/change the Outcome compared to the Comparison within the Time specified?
6.4. Time: Follow-Up Duration and Timing of Analysis
The Time (T) element in PICOT, when specified, sets the temporal context for the intervention and outcome measurement. Statistically, time can play a role in both the design and analysis:
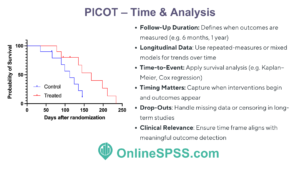
Follow-Up Duration: Time might indicate how long participants are observed. If an outcome is assessed at a specific time point (e.g. healing at 8 weeks, mortality at 1 year), the analysis is often straightforward at that time (comparing groups at that endpoint). However, if some subjects are lost to follow-up before that time, researchers must consider censoring those data or use methods to handle missing data. The PICOT question’s Time frame helps determine the endpoint for analysis.
Longitudinal Analysis: If outcomes are measured at multiple time points (e.g. weekly, monthly), the presence of a Time component means the data have a repeated measures structure. As discussed, repeated-measures ANOVA or mixed models (also known as multilevel models) are employed to analyze trends over time and group-by-time interactions. For example, if a PICOT question asks whether an intervention leads to faster improvement over 6 months, one would look at time × group interaction in a longitudinal model.
Time-to-Event Data: In many clinical studies, Time is not just an arbitrary endpoint but part of the outcome itself – for instance, time until an event occurs. PICOT may frame questions like, “within 5 years” or “over a 10-year period,” implying interest in whether the event happens and when. Survival analysis comes into play here. Techniques such as Kaplan-Meier survival curves can estimate the probability of remaining event-free over time in each group, and the log-rank test compares these curves. The hazard ratio from Cox regression quantifies differences in the rate at which events occur between intervention and control. For example, if T = 5 years, one might report 5-year event rates or median time-to-event in each group, and whether the differences are significant.
Timing of Intervention and Outcome Measurement: Time also encompasses how long the intervention is applied or observed. For instance, an intervention might be a short course vs. long course of a therapy. In analysis, one might need to consider exposure time. In the factorial RCT example, frequency and duration (time) of treatment were factors – analysis there involved comparing combinations like 2 weeks vs 6 weeks of treatment. In observational studies, differing lengths of follow-up can be adjusted by calculating incidence rates (events per person-year) and comparing those, or by using time-adjusted models.
Multiple Time Points and Multiple Testing: If a study peeks at outcomes at several time points (say interim analyses or multiple endpoints over time), there is a statistical consideration of multiple comparisons. Adjustments or careful interpretation are needed to avoid false positives. Some trials designate a specific time (like “at 6 months”) as the primary endpoint to answer the PICOT question, even if they measure other times.
PICOT – Time to Event Analysis
In essence, the Time element ensures the research question specifies when and for how long the outcome is assessed. Statistically, honoring the Time element means using appropriate methods to account for time in the analysis. If Time is short, one might do a simple endpoint comparison; if Time is prolonged and variable, one employs survival or longitudinal methods. Also, time frames can affect the clinical relevance – e.g. a difference at 6 weeks might disappear by 1 year, so researchers often extend follow-up to see if outcomes persist. The PICOT question might explicitly include a long-term follow-up (such as “at 1 year” or “over 5 years”), pushing the study design to include that and plan analyses accordingly (like Kaplan-Meier estimates at 5 years).
Finally, timing considerations intersect with other components: For example, if a study’s follow-up is too short, it might miss when certain outcomes manifest. Conversely, very long follow-up might introduce more drop-outs. Thus, the Time specified in PICOT is often a compromise between what is clinically meaningful and what is feasible. Researchers might perform sensitivity analyses to see if results differ at different time cut-offs or use statistical techniques to account for people who do not complete the full follow-up (like intention-to-treat analysis in trials, which includes outcomes of drop-outs by certain assumptions).
7. Conclusion: From PICOT Question to Statistical Evidence
By integrating all these components – Population, Intervention, Comparison, Outcome, and Time – the PICOT framework not only structures the research question but also the entire research process from design to analysis. It ensures that the study remains focused on the key question and that the data collected can directly answer that question. Professionals in clinical and nursing research rely on PICOT to make their investigations feasible, relevant, and rigorous. When it comes time to analyze data, the PICOT elements guide which statistical tests are appropriate and how results should be interpreted in context. In summary, PICOT is a powerful tool that links the formulation of a question to the generation of evidence and ultimately to evidence-based practice, enabling healthcare decisions to be based on well-structured research findings
8. Get Help for PICOT Data Analysis
If you’re conducting PICOT-based research and require statistical expertise, OnlineSPSS.com is here to assist. Our specialists simplify complex statistical tasks, delivering clear, publishable results tailored specifically to your PICOT framework.
Expert Statistical Data Analysis and Writing Services Tailored for Academic Research.
Get Accurate Insights, Reliable Results, and Professional Guidance.