fbpx

    How to Perform Pearson
    Correlation in R

    Looking for a Pearson Correlation in R? Doing it yourself is always cheaper, but it can also be a lot more time-consuming. If you’re not good at R programming, you can pay someone to do your R task for you.

    What is a Pearson Correlation Analysis?

    Correlation describes the strength and direction of the linear relationship between two variables. Pearson’s correlation coefficient is used for interval variables, and Pearson’s correlation coefficient can only take values from -1 to +1. The sign indicates whether the correlation is positive (both variables decrease or increase) or negative (one variable decreases when the other increases and vice versa). A perfect correlation, 1 or -1, indicates that the value of one variable can be accurately determined when we know the value of the other. A correlation equal to 0 indicates no relationship between the two variables.

    When Should a Pearson Correlation be Used?

    Pearson’s correlation coefficient is the test statistic that measures the statistical relationship, or association, between two continuous variables. So, you should use the Pearson correlation coefficient when (1) the relationship is linear and (2) both variables are quantitative and (3) normally distributed, and (4) have no outliers.

    An Example Of Pearson Correlation Test

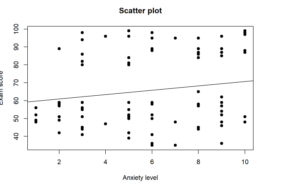
    For example, a teacher wants to examine the relationship between the level of anxiety and the exam score. Then we have two variables: the level of anxiety and the exam score.

    Therefore, we test the following hypotheses:

    Null hypothesis: There is no significant effect relationship between the level of anxiety and exam score.

    Alternative hypothesis: There is a significant effect relationship between the level of anxiety and exam score

    R function to Compute Pearson Correlation

    The code to run a Pearson Correlation Analysis using R is as follows:

    cor.test (x, y, method=(“pearson”, “kendall”, “spearman”), data = dataframe)

    x, y: numeric vectors with the same length

    method: correlation method

    Running Pearson Correlation in Rstudio

    In this section, we will show you how to run the Pearson correlation analysis using the r studio program and how to interpret the test results after we obtain the result of the test. In the first part, we present the r program code and function for the correlation analysis. Next, you will see the outputs as a result of running the r codes. In the last section, you can find the interpretation of the Pearson correlation in APA format.

    # LOAD DATA
    library(readxl)
    Data <- read_excel(“Data.xlsx“)
    # VIEW DATA
    View(Data)
    # NAME VARIABLES
    data <- Data
    anxiety <- data$anxiety
    exams <- data$exams
    # PERFORM PEARSON CORRELATION ANALYSIS
    cor.test(anxiety, exams, method=c(“pearson”))

    # SCATTERPLOT 
    plot(anxiety, exams, main=”Scatter plot”, xlab=”Anxiety level”, ylab=”Exam score”, pch=19)
    abline(lm(exams~anxiety), col=”black”)

    > cor.test(anxiety, exams, method=c("pearson"))
    ## 
    ##  Pearson's product-moment correlation
    ## 
    ## data:  anxiety and exams
    ## t = 1.5724, df = 97, p-value = 0.1191
    ## alternative hypothesis: true correlation is not equal to 0
    ## 95 percent confidence interval:
    ##  -0.0410285  0.3443544
    ## sample estimates:
    ##       cor 
    ## 0.1576603
    
    > plot(anxiety, exams, main="Scatter plot", xlab="Anxiety level", ylab="Exam score", pch=19)
    > abline(lm(exams~anxiety), col="black")


    Reporting Pearson Correlation in R

    Pearson correlation coefficient was computed to determine the relationship between anxiety level and exam score. The results indicate a non-significant negative weak relationship, r(97) = 0.16, p = 0.12. We, therefore, fail to reject the null hypothesis and conclude that there is no significant relationship between anxiety level and exam score.

    Are you in trouble with RStudio?

    GET HELP FROM US

    There is a lot of statistical software out there, but R is one of the most popular. If you’re a student who needs help with R Studio, there are a few different resources you can turn to. We prepared a page for R tutorial for Beginners. All contents can guide you through Step-by-step R data analysis tutorials and you can see Basic Statistical Analysis Using the R Statistical Package.

    The second option is that you can get help from us, we give R Studio help for students with their assignments, dissertation, or research. Doing it yourself is always cheaper, but it can also be a lot more time-consuming. If you’re not the best at SPSS, then this might not be a good idea. It can take days just to figure out how to do some of the easier things in SPSS. So paying someone to do your R task will save you a ton of time and make your life a lot easier.

    The procedure of the R help service at OnlineSPSS.com is fairly simple. There are three easy-to-follow steps.

    1. Click and Get a FREE Quote
    2. Make the Payment
    3. Get the Solution

    Our purpose is to provide quick, reliable, and understandable information about Rstudio data analysis to our clients.

    Open chat
    1
    Need Data Analysis Help ?
    Hello,
    How may I help you?