How to Write Results in a Dissertation: A Step-by-Step Guide for Students
The results chapter is one of the most critical parts of a dissertation because it presents the findings of your research in a structured and objective manner. Unlike the introduction or literature review, which provide background, or the methodology chapter, which explains how data were collected and analysed, the results section is solely focused on what your research has revealed. It is the point where your data begins to speak, offering clear answers to your research questions or hypotheses.
Many students find this stage challenging. Some present too little detail, while others overwhelm readers with unnecessary statistical outputs or excessively long transcripts. The key to success lies in presenting your findings logically, concisely, and in alignment with your research aims. This guide explains step by step how to write results in a dissertation, covering both quantitative and qualitative studies, as well as mixed methods designs.
Discover our complete dissertation guide series: [Abstract], [Introduction], [Literature Review], [Methodology], [Results], [Conclusion], [Discussion], [References], and [Appendix].
What is the Purpose of the Results Section in a Dissertation?
The purpose of the results chapter is to present your research findings in a clear and neutral way. Your aim is not to interpret or evaluate the results but to describe what the analysis revealed. Interpretation is reserved for the discussion chapter.
For instance, in a quantitative dissertation, the results may include descriptive statistics, significance testing, and regression outputs. In a qualitative dissertation, the results focus on themes, categories, and illustrative quotations. Regardless of methodology, your results chapter should:
- Answer the research questions or test the hypotheses you stated earlier.
- Present data in a structured and organised fashion.
- Provide enough information for readers to understand what was found without overwhelming them with raw data.

How Should You Structure the Results Chapter?
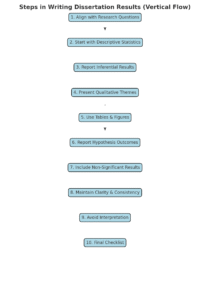
The structure of the results section should mirror the research objectives set out in your introduction. A logical sequence ensures that readers can easily follow the flow from your research questions to your findings.
For quantitative dissertations, a common order is:
- Descriptive statistics (sample demographics, means, standard deviations).
- Testing assumptions if relevant (normality, multicollinearity).
- Inferential results (t-tests, ANOVA, regression, correlations).
- Hypothesis testing outcomes.
For qualitative dissertations, results are typically structured thematically:
- Overview of data analysis process.
- Main themes and sub-themes.
- Supporting quotes or case examples.
- Summary of findings in relation to research questions.
In mixed methods dissertations, the results may be presented in either a sequential (quantitative then qualitative, or vice versa) or integrated manner, depending on your chosen design.
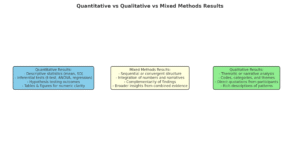
Quantitative vs Qualitative vs Mixed Method Results
What to Include in Quantitative Results?
Quantitative dissertations often require statistical analysis. The level of detail will depend on your methodology, but key components generally include:
- Descriptive statistics: Summarise demographic variables and key measures. For example, “The mean age of participants was 32.4 years (SD = 6.1).”
- Inferential statistics: Report findings from tests such as independent t-tests, ANOVA, regression, or chi-square. Include test statistics, degrees of freedom, p-values, and effect sizes.
- Assumptions: If you checked statistical assumptions (normality, linearity), report whether they were met.
- Tables and figures: Use visual aids to present data more clearly, but avoid duplicating information in both text and table form.
Example:
“An independent samples t-test showed that male participants scored significantly higher on stress levels (M = 22.3, SD = 4.5) than female participants (M = 19.8, SD = 4.0), t(98) = 2.34, p = .02, Cohen’s d = 0.45.”
How to Present Qualitative Results in a Dissertation?
Qualitative results require a different approach. Instead of numbers, you will present narratives, patterns, and participant experiences. The most common method is thematic analysis.
Steps include:
- Introduce the analysis process: Briefly explain how codes were generated and themes were identified.
- Present each theme: Provide a descriptive title for each theme and explain its meaning.
- Include evidence: Use direct quotations from participants to illustrate themes.
- Relate back to research questions: Show how each theme answers specific questions.
Example:
A theme of “Workplace Support” emerged from the interviews. Several participants described how supportive managers reduced stress. One participant explained, “Having my manager check in weekly made a huge difference. I felt less isolated.”
This approach demonstrates transparency and gives participants a voice in the findings.
When and How to Use Tables and Figures?
Tables and figures make results more digestible, especially in quantitative research. However, they must be used appropriately.
- Tables: Best for presenting precise numbers such as descriptive statistics or regression coefficients.
- Figures (charts, graphs): Useful for visualising trends, differences, or distributions.
- Formatting: Always follow your referencing style (APA, Harvard, etc.). Number tables and figures sequentially and provide clear titles.
Important: Do not repeat all data in the text if already displayed in a table. Instead, highlight key points.
Should You Interpret Results in This Section?
The results chapter should focus on what was found, not why it was found. Interpretation belongs to the discussion chapter. Avoid sentences like “This suggests that social support reduces stress” in your results. Instead, stick to factual reporting, such as “Participants with higher social support scores reported lower stress levels (r = -.42, p < .001).”
By keeping the results objective, you maintain academic rigour and prevent redundancy when writing the discussion.

How to Report Hypothesis Testing Results?
If your dissertation involves hypothesis testing, ensure results are reported with precision. For each hypothesis:
- State whether the null hypothesis was rejected or retained.
- Provide exact test statistics, p-values, and effect sizes.
- Report confidence intervals where relevant.
Example:
“H1 predicted that exercise frequency would positively correlate with wellbeing. A Pearson correlation supported this hypothesis, r(120) = .36, p < .001, 95% CI [.21, .49].”
This approach ensures transparency and replicability.
How to Report Non-Significant Results?
Many students are tempted to downplay or omit non-significant results, but this is a mistake. Non-significant findings are important because they contribute to the full picture of your research.
For example:
“There was no significant difference in anxiety scores between undergraduate and postgraduate students, t(85) = 0.94, p = .35.”
Reporting such findings demonstrates integrity and prevents publication bias.
What is the Best Way to Report Results in Mixed Methods Dissertations?
Mixed methods dissertations combine both numerical and narrative data. You must carefully integrate findings to avoid confusion.
Two strategies exist:
- Sequential reporting: Present all quantitative results first, followed by qualitative.
- Convergent reporting: Present findings side by side when they address the same research question.
Example:
Quantitative data may show a statistically significant link between social support and stress reduction, while qualitative interviews reveal detailed accounts of how participants felt supported. Together, they provide richer insights.
How to Maintain Clarity and Consistency in Results?
Clarity is essential for readability. To achieve this:
- Present results in the same order as your research questions.
- Use consistent terminology (e.g., if you use “participants” at the start, avoid switching to “respondents” later).
- Clearly define abbreviations and keep them consistent.
- Refer to appendices for raw outputs rather than inserting lengthy tables into the main text.
Common Mistakes to Avoid in Writing Results
Students often fall into the following traps:
- Over-interpreting findings: Adding explanations that belong in the discussion.
- Copying raw outputs: Pasting entire SPSS or NVivo outputs without refinement.
- Inconsistent formatting: Mixing table styles or numbering incorrectly.
- Neglecting non-significant results: Only highlighting findings that support hypotheses.
Avoiding these errors enhances professionalism and clarity.
Should You Include Limitations in the Results Chapter?
In most dissertations, limitations are discussed in the discussion chapter. However, in some cases, a brief mention may be appropriate, particularly if results were affected by missing data or violated assumptions. For example, you might note, “Although normality assumptions were violated, a non-parametric test was used to address this issue.”
How Long Should the Results Section Be?
The length of the results chapter varies widely. For a Master’s dissertation, results are often between 2,000 and 4,000 words, while a PhD may extend beyond 10,000 words depending on data complexity.
The key principle is proportionality: the results should be long enough to answer research questions comprehensively but not so long that they become unreadable.
Final Checklist for Writing Results in a Dissertation
Before finalising your results chapter, review this checklist:
Are results reported objectively and without interpretation?
Are tables and figures correctly formatted and labelled?
Do findings directly address research questions or hypotheses?
Are non-significant results included?
Is the chapter logically structured and consistent?
Have raw outputs been refined for clarity?
If you can answer “yes” to all these questions, your results chapter is on the right track.