Expert support for data analysing, interpreting, and reporting academic research. Get help with data analysis, methods, and writing results—accurate, fast, and tailored to your research study.
At OnlineSPSS.com, we offer expert statistical support and data analysis for all types of research design. We assist with cross-sectional studies, cohort studies (prospective or retrospective), randomized controlled trials, longitudinal designs, experiments, qualitative research, and mixed methods, delivering accurate, clear, and ready-to-submit results.
Who We Help: PhD Students, Researchers, Academic Staff Project Types:Dissertations, Academic Papers, Assignments, Research Projects, DNP Projects Our Services: Study Design, Data Management, Statistical Analysis, Writing Methodology, Reporting Results
Whether you work with IBM SPSS, R, Stata, NVivo, MAXQDA, Ms Excel or another software, our statisticians are experienced in all tools required for your Academic Research. From designing your study to interpreting final results, we’re with you every step of the way.
Click “Get Instant Quote” fill in required details, and upload supporting files.
2. Make the Payment
Pay securely through PayPal after receiving your custom quote.
3. Get Your Solutions
Receive high-quality, plagiarism-free results via email on time.
Introduction
In this guide, you’ll learn everything you need to know about a cross-sectional study—from what it is, when to use it, and how to collect and analyse data, to the key statistical tests involved. Whether you’re preparing a dissertation, academic project, or professional research, this page will help you understand the purpose, features, advantages, and limitations of cross-sectional research. You’ll also find examples and practical tips, along with expert support options to simplify your data analysis process.
1. What is a Cross-sectional Study in Research?
A cross-sectional study is one of the most commonly used research designs in academic and clinical research. It involves collecting data from a population or a specific group at a single point in time. Researchers use this method to assess the current status of variables, explore associations, and describe trends without tracking changes over time. Whether you’re working on a dissertation, academic paper, or professional research project, understanding how a cross-sectional study works is essential for choosing the right design and performing accurate data analysis.
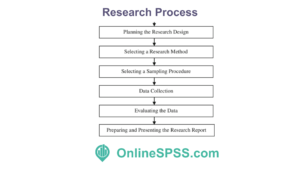
Academic Research Process
This method is widely used in social sciences, medicine, psychology, and public health. It helps researchers understand patterns, identify risk factors, or measure current behaviours and opinions. Since data is only collected once, the study is faster and less expensive than those involving follow-up.
Key points:
Captures information at a single time point
Measures many variables simultaneously
Often used to assess prevalence
Common in surveys, interviews, or medical screenings
2. What is the Key Feature of a Cross-sectional Study?
The most important feature of a cross-sectional study is its one-time data collection approach. It does not track changes over time. Instead, it provides a clear view of a subject group at a single moment. This simplicity makes the design popular for large population surveys and baseline assessments.
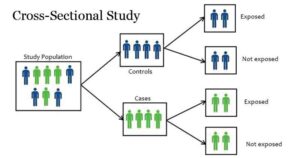
Cross-Sectional Study Diagram
The study measures outcomes and exposures at the same time. For instance, a researcher might examine income level and mental health in a community through a one-time survey. Since the timing is simultaneous, it’s impossible to determine which factor came first.
Key features:
One-time observation with no follow-up
Cannot determine causal relationships
Often uses large, representative samples
Ideal for quick, low-cost data collection
👉 Get a Free Quote Today and let our team support your cross-sectional research with expert guidance and clear results.
3. Why Do We Choose Cross-Sectional Studies?
Researchers often choose cross-sectional studies because they are quick, practical, and cost-effective. When there’s a need to understand a population’s characteristics or to explore associations between variables, this design is a perfect starting point.
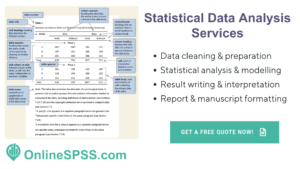
Statistical Data Analysis Services
These studies are especially helpful when planning health programmes, policy changes, or further research. Since they can collect data from large groups in a short time, they are a great way to assess community needs or trends.
Reasons to choose:
Efficient for large-scale surveys
Helps identify associations between variables
Great for hypothesis generation
Supports baseline assessments before clinical trials or interventions
👉 Get a Free Quote Today and let our team support your cross-sectional research with expert guidance and clear results.
4. What is an Example of a Cross-sectional Study?
Let’s say researchers want to explore whether sleep problems are more common in shift workers. They survey 1,000 employees from various industries on one day, asking about their work hours and sleep quality.
In this example, both the exposure (shift work) and the outcome (sleep quality) are measured at the same time. Researchers can see if a relationship exists, but they cannot say if shift work causes poor sleep.
Example study setup:
Population: 1,000 workers
Variables: Work type, sleep hours, sleep satisfaction
Design: Single survey completed in one week
👉 Get a Free Quote Today and let our team support your cross-sectional research with expert guidance and clear results.
5. Pros and Cons of Cross-Sectional Study
Cross-sectional studies come with several benefits, especially for researchers with limited time or budget. They allow fast collection and analysis of large amounts of data. However, they also have limitations, particularly when it comes to understanding cause and effect.
Because the data is collected at one point in time, it’s impossible to know which factor occurred first. This makes it hard to determine if one variable truly affects another.
Pros:
Quick and affordable
Measures multiple variables at once
Useful for public health planning
Allows prevalence estimation
Cons:
Cannot prove causal relationships
Prone to recall bias
Temporal ambiguity – unclear what happened first
6. How to Collect Data for a Cross-Sectional Study?
To collect data for a cross-sectional study, researchers use structured tools such as surveys, questionnaires, interviews, or checklists. These are distributed to a carefully selected sample that represents the population.
The process begins by clearly defining the research question and target population. Then, a suitable sampling method is chosen — such as random or stratified sampling. Finally, ethical approval and informed consent are obtained before data collection begins.
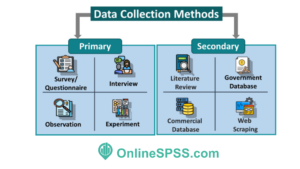
Data Collection Methods in Academic Research
Common data collection methods:
Online or paper-based surveys
Face-to-face or phone interviews
Secondary data from health records or databases
Mobile or digital app-based questionnaires
👉 Get a Free Quote Today and let our team support your cross-sectional research with expert guidance and clear results.
7. What is the Data Analysis of a Cross-sectional Study?
Data analysis in a cross-sectional study starts with descriptive statistics. These describe the basic features of the data, such as the mean, median, or percentage. The goal is to summarise the sample and provide insights into the main variables.
Once the data is summarised, inferential statistics are used to test relationships or group differences. Statistical software such as SPSS, R, or Python can help manage large datasets and perform these calculations quickly.
The analysis includes:
Descriptive statistics – frequencies, means, standard deviation
Group comparisons – t-tests or chi-square tests
Exploratory analysis – trends and associations
👉 Get a Free Quote Today and let our team support your cross-sectional research with expert guidance and clear results.
8. What Statistical Tests are Used in Cross-Sectional Studies?
The tests used in a cross-sectional study depend on the type of variables. When comparing groups or testing for relationships, researchers use various tests to ensure statistical rigour.
For example, categorical data (like gender or education level) can be tested with a chi-square test. Continuous data (like income or blood pressure) might require a t-test or regression analysis. These tests help to assess whether differences or associations are statistically significant.
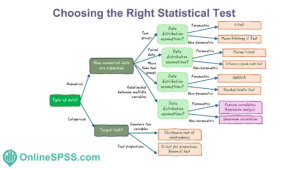
Choosing the Right Statistical Test
Common tests:
Chi-square test – for two categorical variables
T-test / ANOVA – for comparing group means
Correlation analysis – for linear relationships
Linear or logistic regression – for prediction and control of confounding
👉 Get a Free Quote Today and let our team support your cross-sectional research with expert guidance and clear results.
9. How Do You Analyze Data in a Cross-Sectional Study?
Analysing data from a cross-sectional study involves a clear sequence. First, data is cleaned — removing errors, duplicates, or missing values. Next, descriptive statistics give an overview of each variable’s distribution. Then, comparisons between groups or relationships between variables are tested using inferential statistics.
If researchers expect confounding variables (like age or gender), they can include them in a regression model. This helps clarify the unique effect of the main variable of interest. Finally, the results are interpreted and reported in tables or graphs.
Steps to follow:
Clean and prepare data
Summarise data with descriptive statistics
Test for associations
Run multivariate analysis if needed
Interpret and report findings
10. Statistical Data Analysis Help for Cross-Sectional Study
If you’re working on a cross-sectional study for your dissertation, thesis, or journal article, professional data analysis support can save time and improve accuracy. At OnlineSPSS.com, we assist researchers at every step, from design to final interpretation.
Our team of expert statisticians ensures that the right statistical tests are applied, and all results are clearly explained. Whether you’re stuck with SPSS, need help building a table, or want your results written in APA format, we’ve got you covered.
What we offer:
Data coding and cleaning
Appropriate test selection (t-tests, chi-square, regression)
Full data analysis using selected statistical software
Data analysis interpretation
APA-style tables and charts
Guidance on how to write your results section
👉 Get a Free Quote Today and let our team support your cross-sectional research with expert guidance and clear results.
📺 Visit our YouTube Channel for SPSS and qualitative data tutorials, tips, and academic writing guidance.
✅ Follow us on LinkedIn for useful Statistical Content.
Need Help with Data Analysis?
Expert Statistical Data Analysis and Writing Services Tailored for Academic Research.
Get Accurate Insights, Reliable Results, and Professional Guidance.