Expert support for data analysing, interpreting, and reporting academic research. Get help with data analysis, methods, and writing results—accurate, fast, and tailored to your research study.
At OnlineSPSS.com, we offer expert statistical support and data analysis for all types of research design. We assist with cross-sectional studies, cohort studies (prospective or retrospective), randomized controlled trials, longitudinal designs, experiments, qualitative research, and mixed methods, delivering accurate, clear, and ready-to-submit results.
Who We Help: PhD Students, Researchers, Academic Staff Project Types:Dissertations, Academic Papers, Assignments, Research Projects, DNP Projects Our Services: Study Design, Data Management, Statistical Analysis, Writing Methodology, Reporting Results
Whether you work with IBM SPSS, R, Stata, NVivo, MAXQDA, Ms Excel or another software, our statisticians are experienced in all tools required for your Academic Research. From designing your study to interpreting final results, we’re with you every step of the way.
Click “Get Instant Quote” fill in required details, and upload supporting files.
2. Make the Payment
Pay securely through PayPal after receiving your custom quote.
3. Get Your Solutions
Receive high-quality, plagiarism-free results via email on time.
Introduction
In this article, you’ll learn everything you need to know about correlational study design—what it is, how it works, and when to use it. We’ll cover its key features, data collection methods, statistical analysis, and interpretation of results. If you’re preparing a dissertation, journal article, or academic project, this guide will help you understand the strengths, limitations, and appropriate use of correlational research in real-world settings.
A correlational study design is a type of non-experimental research used to measure the relationship between two or more variables without manipulating them. Instead of assigning participants to groups or applying treatments, researchers observe naturally occurring variables and assess how they change together.
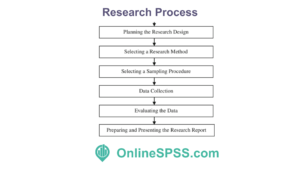
Research Process
The goal of a correlational study is not to prove causation, but to determine whether a relationship exists and how strong that relationship might be. This design is commonly used in psychology, education, health sciences, and business to explore trends, make predictions, and identify possible connections that deserve further investigation.
Key points:
Examines relationships between variables
Involves no manipulation or control
Often used to generate hypotheses for future research
The main feature of a correlational study is that it measures the degree and direction of association between variables. This is often expressed as a correlation coefficient, such as Pearson’s r, which ranges from -1 to +1. A positive correlation means variables increase together, while a negative one means one decreases as the other increases.
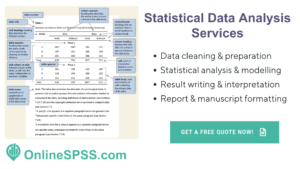
Statistical Data Analysis Services
Another important aspect is that participants are not placed into groups or exposed to conditions. All data is collected as-is, making this method ideal for studying variables that cannot be ethically or practically manipulated.
Key features:
Uses correlation coefficients to measure strength and direction
Data is observational, not experimental
Suitable for exploring patterns and associations in natural settings
Researchers choose correlational study designs when they want to explore connections between variables that already exist in the world. These studies are ideal when it’s unethical, impractical, or unnecessary to manipulate variables—for example, you can’t randomly assign people to smoke or not smoke just to study cancer risk.
They’re also commonly used in the early stages of research to identify possible variables for future experimental study. Correlational designs help narrow the focus of a topic by showing which variables are worth deeper examination.
Reasons for use:
Ethically appropriate when variables can’t be controlled
Helps to identify trends and predict outcomes
Allows for large-scale data collection without intervention
Imagine a researcher wants to know if there’s a link between academic performance and social media use among university students. They survey 500 students, collecting data on hours spent on social media each day and their most recent exam scores.
Using a correlational study, the researcher can see if students who spend more time on social media tend to have lower scores—or if there’s no significant pattern at all.
Example structure:
Variables: Social media use and academic performance
Data: Survey responses from a single time point
Analysis: Pearson correlation to assess strength of relationship
Correlational studies are useful, especially when researchers want to explore real-world relationships without interference. They are relatively quick and inexpensive, and they often use secondary data or simple surveys.
However, they do have limitations. The most important is that correlation does not mean causation. Even if two variables move together, this doesn’t prove that one causes the other.
Pros:
Non-invasive and ethical – no manipulation involved
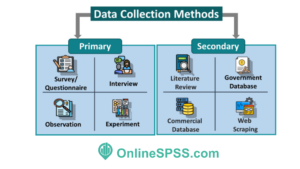
Data collection in correlational studies involves gathering accurate information about two or more variables from the same participants. This can be done using surveys, existing records, behavioural logs, or test scores.
Data Collection Methods
It’s important that all variables are measured with valid and reliable tools. Consistency in data collection is key, as errors or biases can weaken the correlation or create false patterns.
What is the Data Analysis of a Correlational Study?
Once data is collected, analysis begins by computing correlation coefficients, which indicate how strongly variables are related. The most common is Pearson’s correlation for continuous variables. A coefficient close to +1 or -1 shows a strong relationship, while a value near 0 suggests no correlation.
Researchers then test the statistical significance of the correlation. Even if the number is large, it must be backed by a low p-value to ensure the result isn’t due to chance.
Typical analysis includes:
Descriptive statistics – summarise each variable
Scatter plots – visualise the relationship
Pearson or Spearman correlation – depending on data type
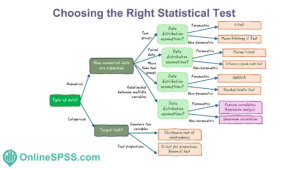
What Statistical Tests are Used in Correlational Studies?
Correlational studies use specific statistical tests depending on the type and distribution of data. For example, Pearson’s r is used when both variables are continuous and normally distributed, while Spearman’s rho is better for ranked or ordinal data.
Choosing the Right Statistical Test
When researchers want to predict one variable based on another, they may use linear regression. However, the core test in this design remains the correlation coefficient.
Common tests:
Pearson correlation – for parametric, continuous data
Spearman correlation – for ordinal or non-parametric data
Kendall’s tau – for smaller samples or tied ranks
Simple linear regression – for prediction, not just association
How Do You Analyse Data in a Correlational Study?
To analyse data in a correlational study, researchers follow a clear process. First, they examine each variable separately to check distribution and accuracy. Then, they use scatter plots to visualise the relationship, followed by correlation coefficients to quantify it.
If the analysis finds a significant correlation, researchers may explore further by adding control variables using partial correlations or regression models. However, all results must be interpreted with the understanding that correlation does not imply causation.
Steps to follow:
Clean and summarise the dataset
Check assumptions for correlation tests
Plot the data to examine patterns
Run correlation tests (Pearson or Spearman)
Report coefficient strength and significance level
Statistical Data Analysis Help for Correlational Study Design
At OnlineSPSS.com, we support students and researchers working on correlational study designs. Whether you’re comparing variables for a dissertation or academic paper, we help you choose the right test, analyse your data, and write your results with confidence.
Our experts provide tailored guidance on statistical tests, interpretation of complex data, and presentation of results in clear, publication-ready formats. We work closely with you to meet your specific research needs and ensure that your study’s outcomes are reliable and well-presented.
Our services include:
Study design consultation and review.
Data coding and cleaning tailored for correlational data.
Advanced statistical analysis using appropriate software.
Clear interpretation and guidance on reporting results.
Support in creating visualisations and APA-style reports.
If you need professional assistance with your correlational research, visit OnlineSPSS.com for a free quote and expert support.
📺 Visit our YouTube Channel for SPSS and qualitative data tutorials, tips, and academic writing guidance.
✅ Follow us on LinkedIn for useful Statistical Content.
Need Help with Data Analysis?
Expert Statistical Data Analysis and Writing Services Tailored for Academic Research.
Get Accurate Insights, Reliable Results, and Professional Guidance.